
With the cost of living constantly breathing down consumers’ necks, the retail and ecommerce market is now brimming with too-good-to-skip deals and once-in-a-lifetime promotions. The era of promotion fatigue is here – Boston Consulting Group found that 60% of consumers would love to receive fewer, but more target promotions instead of one-size-fits-all deals.
How did we get here? Short on time and needing sales, businesses keep spending on promotions even when they're ineffective. More often than not, promotions fall flat due to a lack of tracking and poor analysis of how a specific promotion impacts customer behavior and purchasing patterns.
With this guide, you’ll learn how to calculate the return on investment (ROI) of sales promotions to make better decisions as to which types of deals are more profitable for your bottom line.
Before diving into the nitty gritty of calculating promotions ROI and specific metrics, let’s take a look at some data that’s crucial for promotions reporting.
Before running a promotion, analyze the customer’s willingness to pay for the full-priced product during an extended period. Only with this metric can you compare how a discount impacted the customer’s propensity to buy.
Another key thing to measure before is basket product variance. By analyzing it, you can identify frequently bought-together products and create targeted promotions or bundled offers.
Once the promotion is live measure how the discount impacted the purchase rates of a specific product and see how many transactions were made with and without the discount applied. Other changes to measure include shifts in buying behavior (such as time spent on site) and AOV.
Keep in mind that these metrics can be split by demographics, marketing channels, and website content that customers see.
Accurately measuring the true impact of promotions can be a complex task as simply looking at sales increases doesn't tell the whole story. Factors like discount cannibalization (sales from existing customers that would have happened anyway), pull-forward (sales happening sooner due to the promotion, not representing new customers), competitor actions, and seasonal trends all need to be considered. Another obstacle is the quality of data – retailers need access to historical promotion data, along with the ability to adjust for factors like price changes, marketing efforts, and competitor activity specific to their business context.
We've already established how important accurate measurement of promotions ROI is. Now, let's learn the key metrics you should track to truly see the impact of your sales promotions.
The promotion metrics can be divided into five key categories:
The promotions overview should give you insights into your promotion strategy. Starting from general data on the number of promotions used, attributed revenue, to the number of orders placed with a promotion/promo code.
Here are some metrics you should include in your promotions overview reports:

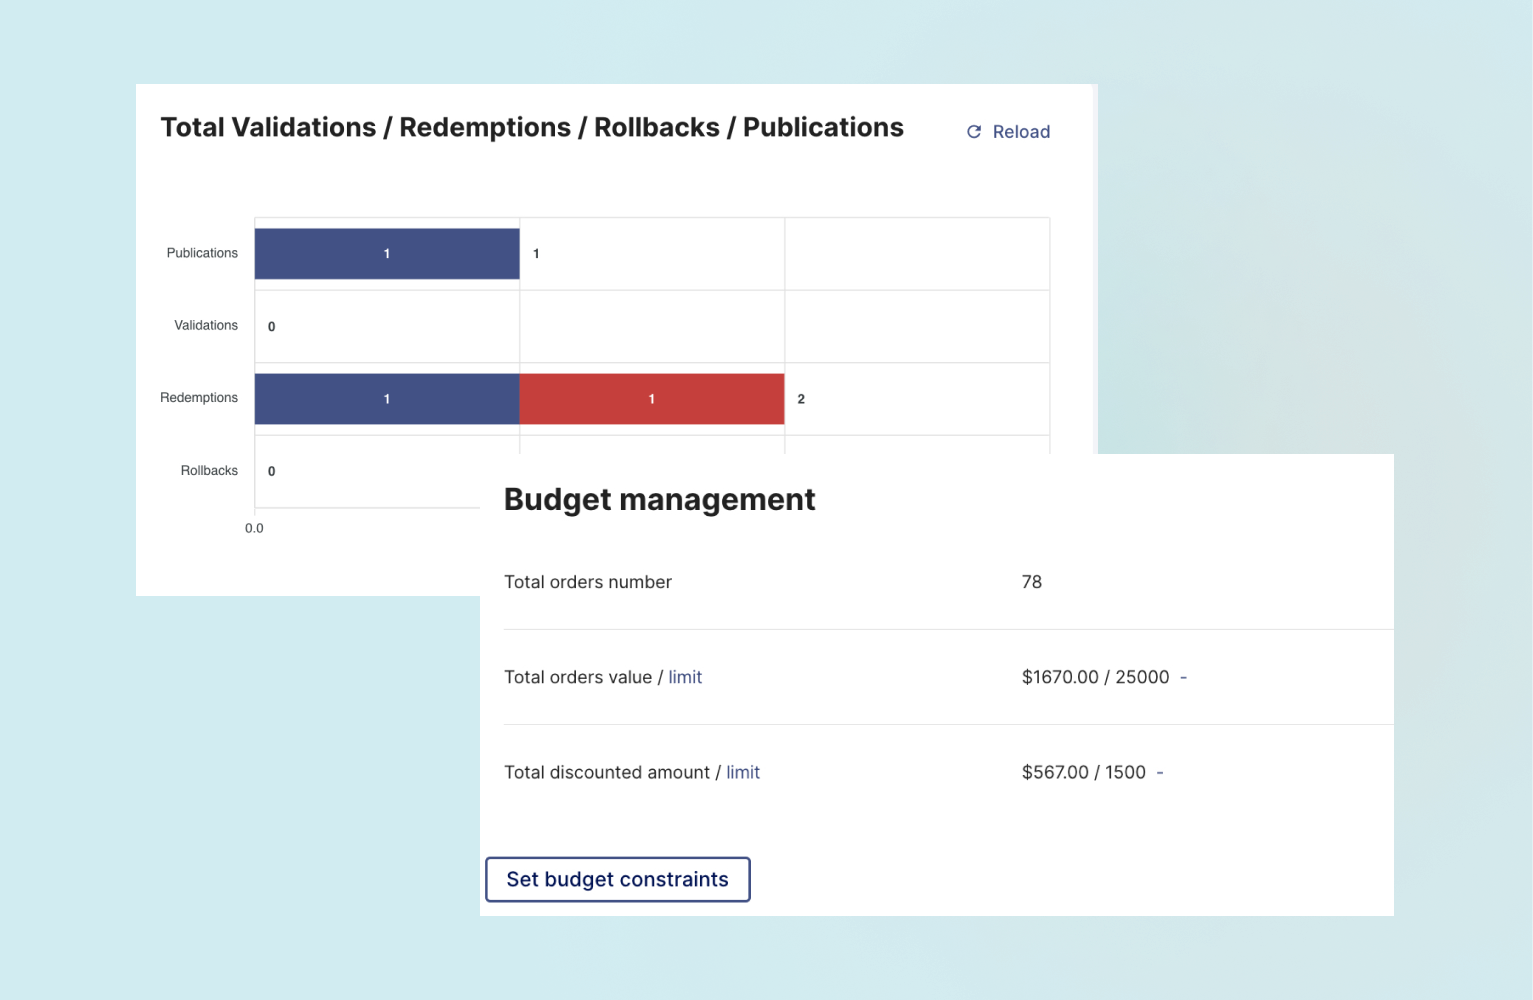
Your promotion dashboard can unify data from your promotion software and ecommerce store to give you detailed view on the promotion revenue impact and promotion co-frequency.
.png)
Once you learn more about the general impact of sales promotions, it’s time for a deep dive into how each promotion drives revenue (or doesn’t).
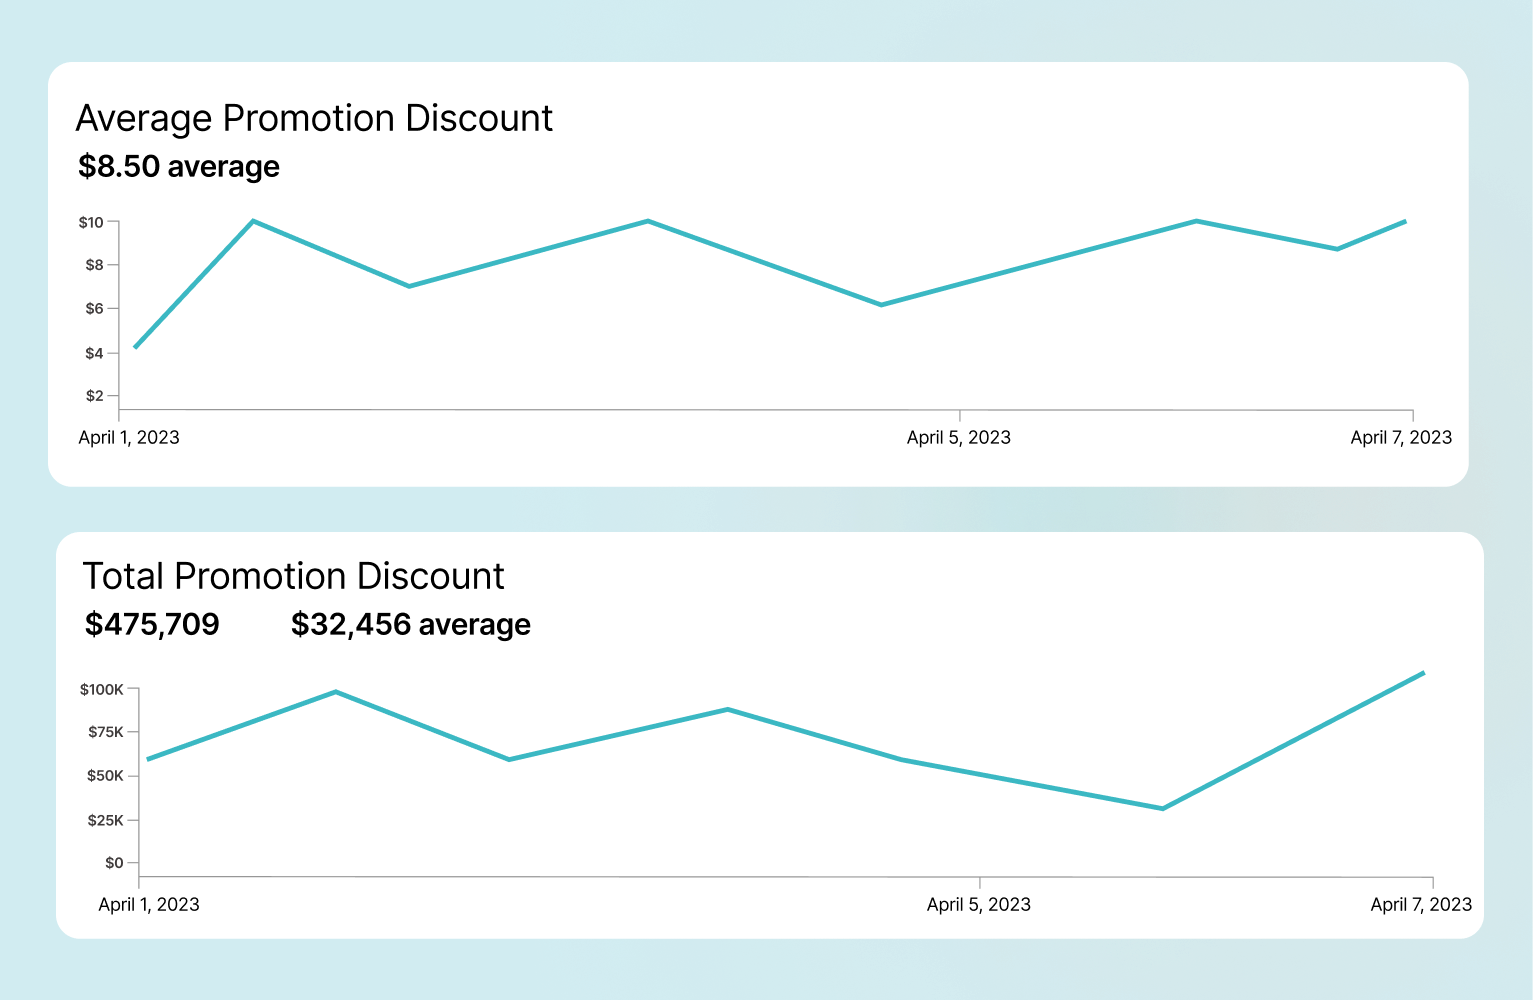
Your custom promotion dashboard built with BI tool can look like this:
Promotion conversion is a useful metric to estimate the impact of promotions on revenue. Promo conversion should give you an overview of how your site traffic uses each promotion category and the rate at which promotions turn into revenue.
The conversion summary and details views should offer the following data with details on the number of all, product, shipping, and order promotions applied respectively per:

To fully estimate the success of your promotion marketing strategies, you also need to take a look at promo codes. To do so, you should build a BI dashboard with the following data:
Each of these metrics can be further detailed with filters on the period (day, week, month), location, region, store, project, or campaign. Another useful metric would be tying customer segments with specific coupon campaigns – this way you get to learn what type of incentives resonate best with which customer profile.
After getting all of the above metrics right, you can go even deeper into cohort analysis of your customers. Cohort analysis is used to understand customer behavior over time. It involves grouping customers based on a shared experience or characteristic (the cohort) and then tracking their actions over a specific period.
To start, you could segment your customers based on various factors, such as signup date, acquisition channel, or past purchase history. Next, monitor which promotion/coupon code each customer within a cohort uses over a defined timeframe (e.g., the following month, quarter, or year). Once you have the data on promotion usage for each cohort, you can identify patterns and trends. For example, you might see that customers who signed up through email marketing are more likely to use a specific discount code compared to those who found you through social media.
Calculating the ROI of sales promotions is nothing more than comparing the net profit and the total cost of running a promotion. Note that the promotion cost can include more than simply a discount – it can cover marketing, advertising, and promotion distribution, too.
Here is how to get started with promotion ROI calculation:
Track sales to understand what sells well without the promotion. By analyzing your inventory, average weekly sales per store, and prior year sales data, you can identify slower-moving goods and bestselling products.
Identify the timeframe for the promotion (start & end dates) as it applies to both sales volume and any associated spending. Consider all promotional costs, including advertising, distribution, or operational investments (e.g., cost of promotion software).
Subtract your baseline sales from total sales to determine the incremental sales generated by the promotion. Multiply the incremental sales by the product's list price to find the incremental gross revenue. Divide your return (profit) by your investment (costs) to get your promotion ROI.
Data export is the first-class citizen in Voucherify. Our APIs have been equipped with many options to extract data in the cadence relevant to your business case. This includes fetching data with API or bulk CSV exports but also webhooks.
While their main task is to help you improve customer experience, they can be used to analyze the impact promotions have on LTV and ultimately, ROI. Here’s how to connect Voucherify to your data pipeline and build business intelligence for your promotion campaigns.
Thanks to the fact that Voucherify offers dozens of dedicated webhooks, the integration comes in three steps:
To give you an overview of the integration process, you can take a look at the following pipeline built with n8n and Apache Superset.
A webhook enables Voucherify to send real-time updates to your app or URL endpoints. Updates are triggered by all or specific events in Voucherify and sent to your URL via HTTP requests. You can create webhooks in the Project Setting by selecting which events should trigger webhooks and specifying the target URL (URL is set in n8n workflow). You can receive all events or choose to listen to redemption events only.

Once the event is triggered, you can check the audit log to see if the webhook sendout was successful.

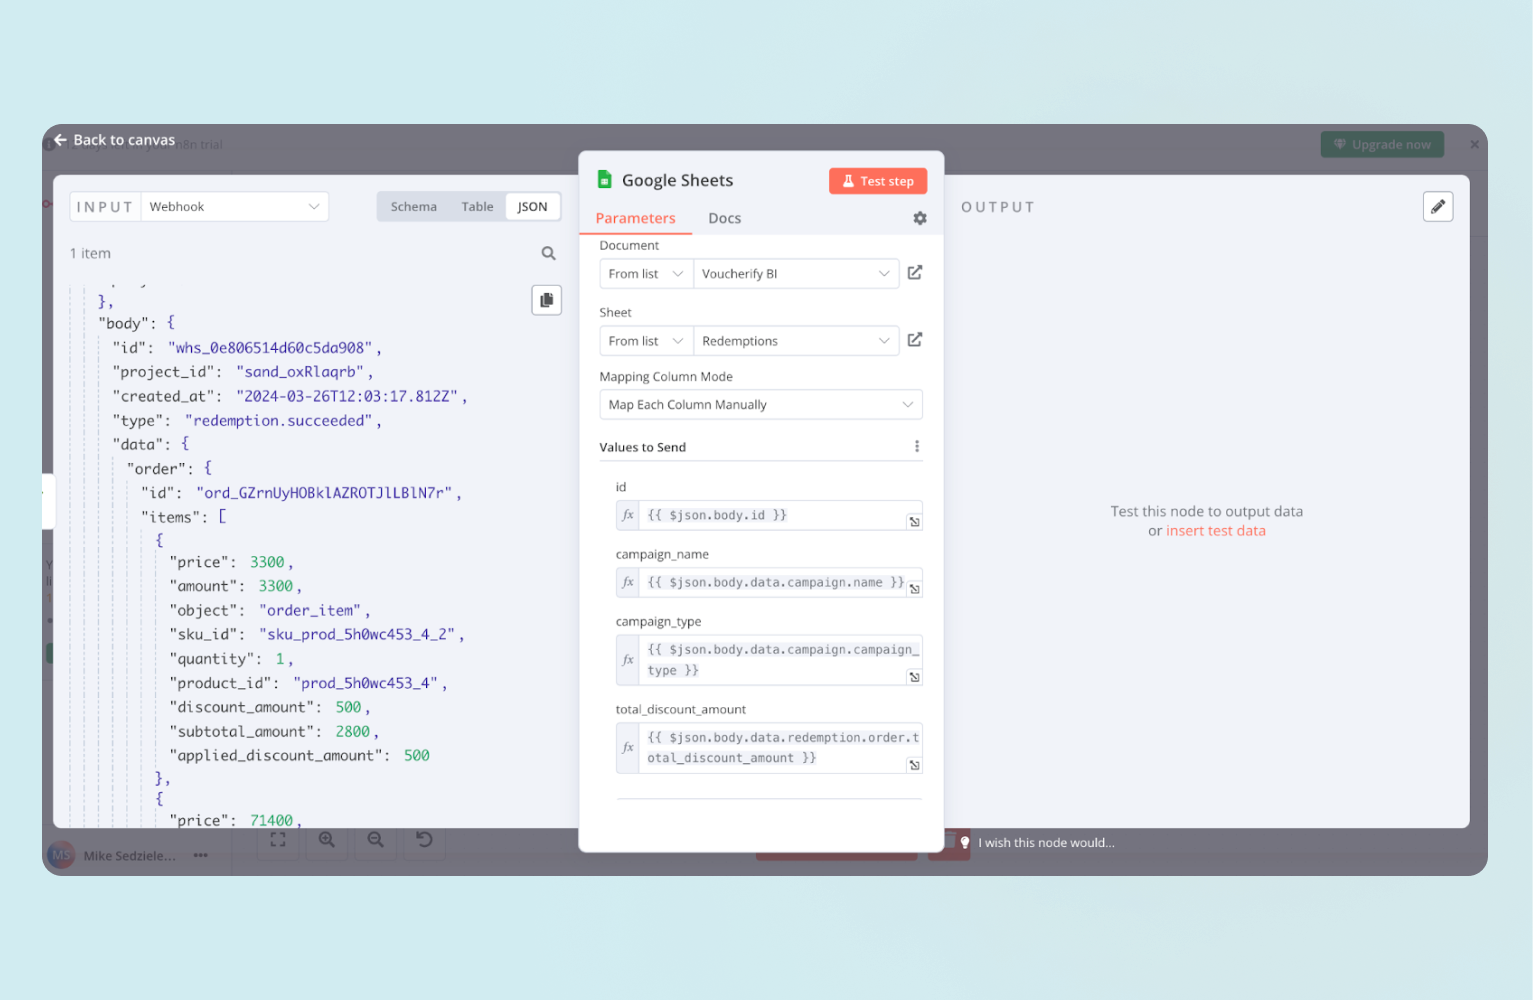
N8n is a popular workflow automation platform. You can use it to capture promotion redemption data from webhooks and pass it to your database (in our case Google Sheets).
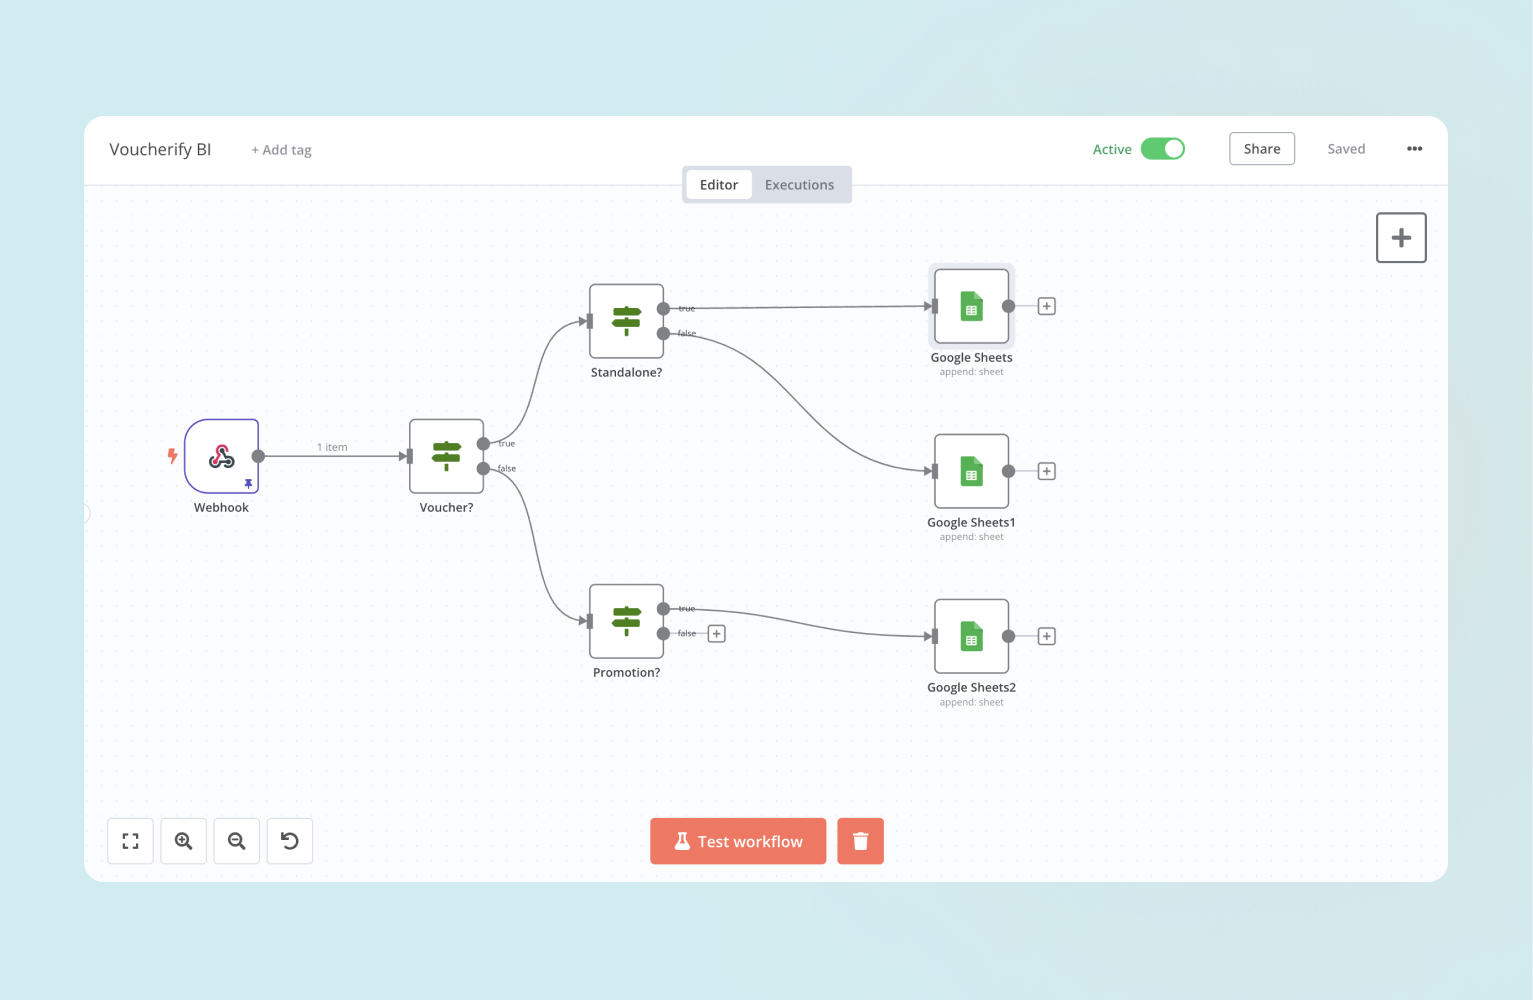
The workflow above first recognized the type of redemption – voucher code versus promotion. This is a necessary step as Voucherify APIs return different data for each.
Next, it’s time to define which data to extract from the webhook and how to transfer it to a selected database (e.g., Google Sheets).
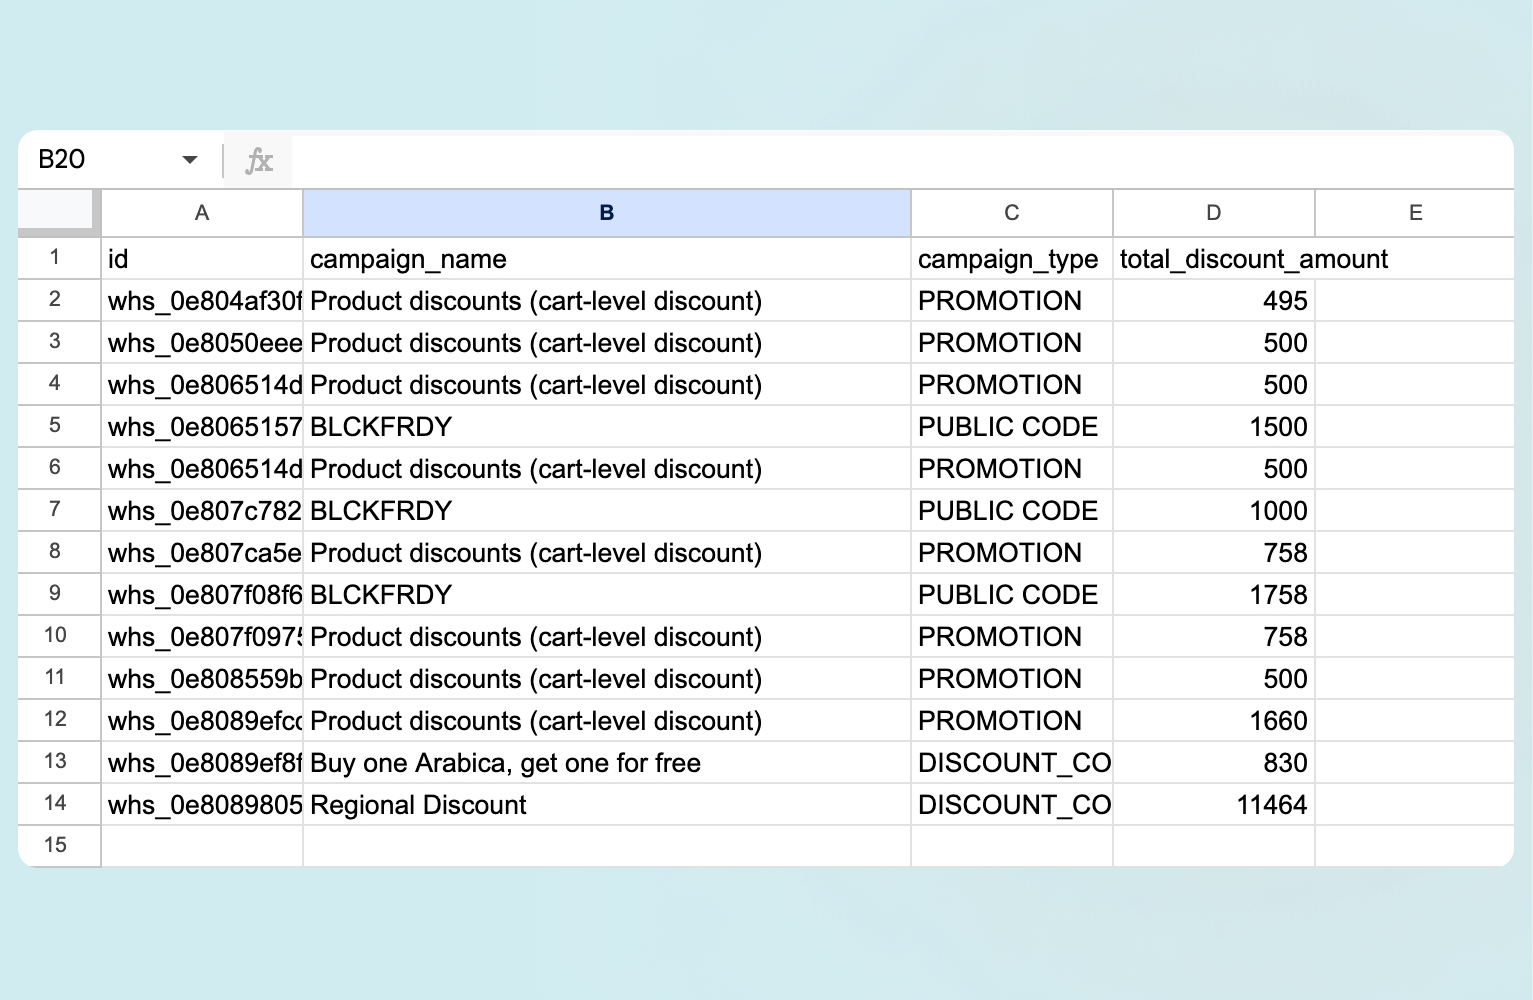
Here is an example of transferred webhooks redemption data landing in the Google Sheets database.
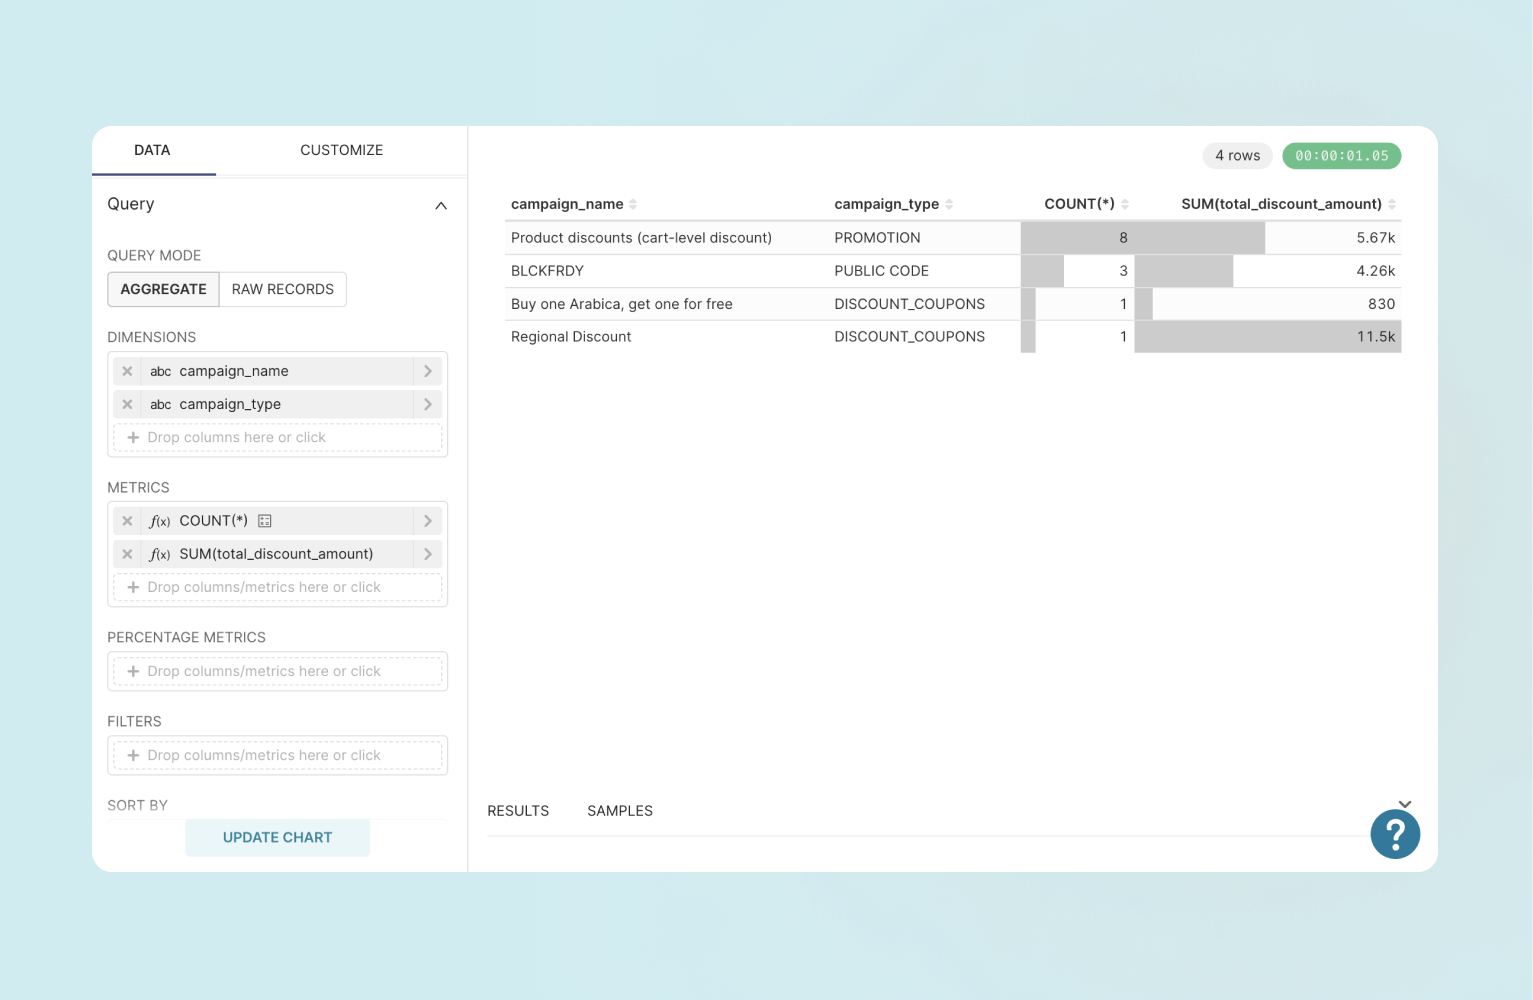
There are plenty of BI tools that you can use to visualize promotion data to better understand the ROI of your discounts – you can give Looker, Tableau, or Microsoft Power BI a try. For this demo, I used Apache Superset. Here is an example of how promotion ROI data can be visualized:
Of course, for the production-ready BI analysis, you would pull more data from Voucherify, including:


